Money and Finance
I ran AT&T through my screening process to see where it currently stands. AT&T is closed on Friday 3/23/12 at $31.52.
DCF Valuation:
Analysts expect AT&T to grow 7.78% per year for the next 5 years and I've assumed that after that they will grow at 2.00%. Running those numbers through the DCF analysis with a 10% discount rate gives a value of $37.21. DCF valuation shows that AT&T is currently undervalued by 15.29%.
Graham Number:
Walmart's TTM EPS is $0.67 with a BVPS of $17.81. Using the Graham Number calculation you get a value of $16.39. Using these numbers AT&T is overvalued by approximately 92%; however, the TTM EPS value is artificially low due to the failed buyout of T-Mobile. If you recalculate based off the forecast $2.35 EPS you get $30.69 meaning that AT&T is currently overvalued by approximately 2.71%.
Average High Dividend Yield:
AT&T's average high dividend yield for the prior 10 years is 6.13% and for the previous 5 years it's 6.36%. Based on the 10 year yield, AT&T's low price should be $28.71. The price based on the 5 year yield is $27.67. This means that AT&T is overvalued by 9.80% and 13.93% respectively.
Average Low PE Ratio:
AT&T's average Low PE Ratio for the past 10 years is 14.90. This number is closer to 12 if you take out the current trailing PE ratio of 47 that AT&T has. Using the 10 year average however you get a value of $35.03 based on analyst estimates of $2.35 EPS. This means that AT&T is currently undervalued by approximatley 10%. The 5 year calculations give a price target of $40.95 with a PE ratio of 17.42. These are even more skewed because of the current 47 PE ratio, taking that out you get a PE target of 11.40 with a price target of $26.79.
Dividend Discount Model:
For the DDM I assumed that AT&T will be able to grow dividends for the next 5 years at the minimum of 15% or the lowest of the 1, 3, 5 or 10 year growth rates. In this case that would be 2.33%. After that I assumed AT&T can continue to raise dividends by 2.0% and used a discount rate of 7.5%. Based on this AT&T is worth $30.71 meaning it's overvalued by 2.63%.
PE Ratios:
AT&T's trailing PE is 47.04 and it's forward PE is 12.41. The trailing PE is so high due to the payout of the failed T-Mobile acquisition. The CAPE for the previous 10 years is 16.26 and taking out the trailing PE from that calculation gives an CAPE of 15.15.
Fundamentals:
AT&T's gross margin is for FY 2011 was 45.28% and FY 2010 was 49.04%. I don't like the direction that the gross margin is heading but it is still very high which is nice to see. They're profit for for FY 2011 was 3.11% and FY 2010 was 15.98%. Once again the T-Mobile issue is rearing it's head. The Cash-to-Debt ratio is 0.05. I'm not too worried about the Cash-to-Debt ratio since AT&T is essentially a utility that demands lots of capital investments usually meaning more debt.
Share Buyback:
AT&T's shares outstanding have increased every year since 2008. Most recently it increased another 1.97%.
Dividend Analysis:
Obviously with a company like AT&T you're interested in current yield and not the dividend growth rate. AT&T's current yield is 5.58%. The 1 year growth rate is 2.33%, 3 year 2.38%, 5 year 4.39% and 10 year 5.69%. None of these are barnburning growth rates but if AT&T can get the growth rate closer to 5% it would be very intriguing.
The payout ratio has been fairly steady above the 70% mark. I would prefer that the payout ratio be lower to allow for larger increases but in AT&T's case I think it's prudent to allow a higher payout ratio. Once again, with AT&T your looking for either stability or high current yield not necessarily dividend growth.
Return on Equity and Return on Capital Invested:
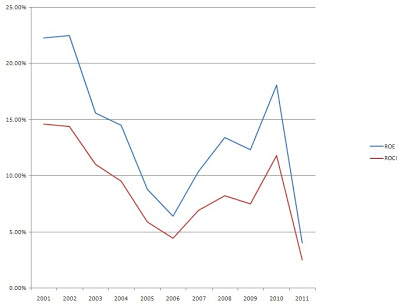
AT&T's ROE and ROCI have been all over the place. Between 2001 and 2006 both values were trending down and since then they began expanding again. The following graph shows AT&T's ROE and ROCI since 2001.

Average Price and EPS:

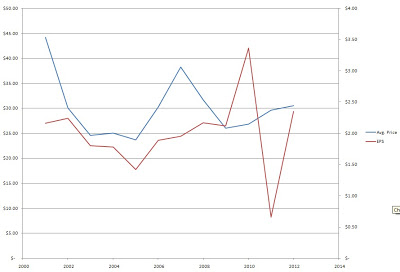
EPS have been all over the place the past 2 years with a huge increase from 2009 to 2010 and then a huge drop off from 2010 to 2011.
Forecast:
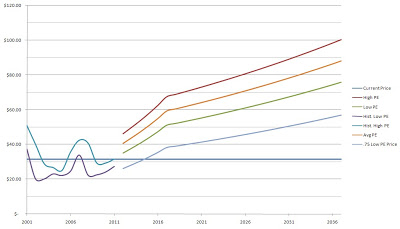
The chart shows the historical prices for the previous 10 years and the forecast based on the average PE ratios and the expected EPS values. I have also included a forecast based off a PE ratio that is only 75% of the average low PE ratio for the previous 10 years. I like to the look to buy at the 75% Low PE price or lower to provide for additional margin of safety. Currently AT&T is trading only $5.25 higher than this value.

Conclusion:
The average of all the valuation models gives a value of $32.47 which means that AT&T is currently trading at a 2.92% discount to the fair value.
Overall I think that AT&T is slightly overvalued at the current price. I would look to get at least a 6% entry yield which corresponds to a purchase price of $29.33. At that entry price you would begin your accumulation at a 16.5% discount to the average valuation. So in other words AT&T is not a stock I would be purchasing now and I would wait for the price to drop.
Selling puts would be one way to begin purchasing at a good margin of safety; however, the current put premiums would not meet my criteria unless you go out until at least July. And even then you would be looking at a only a 5.15% CAGR if the shares were not put to you.
- Mcdonald's Stock Analysis
It's about time for another stock analysis. This time I decided to take a look atMcDonalds (MCD). McDonalds closed on Thursday 5/17/12 at $89.62. Company Background: McDonalds Corporation, together with its subsidiaries, franchises and operates...
- Mattel Stock Analysis
After seeing a few articles about Mattel after selling off due to a weak 1st quarter, which is fairly typical seeing as how they sell toys and after the Christmas season spending is usually light, I decided to run Mattel (MAT) through my screening process...
- Harris Corporation Stock Analysis
I ran Harris Corporation (HRS) through my screening process to see where it currently stands. HRS closed on Wednesday 4/11/12 at $43.81. Company Background: Harris Corporation, together with its subsidiaries, operates as a communications and information...
- Nucor Stock Analysis
Nucor (NUE) operates mini-mills in the steel process. I recently ran their numbers through my spreadsheet and I'm fairly intrigued by the possibilities. Especially since I think the global economy is improving and the demand for steel should increase...
- Jnj Stock Analysis
I've started to try and consolidate my stock analysis spreadsheets to make it easier for myself to cruch numbers. I like JNJ and would love to get in but right now it seems that it's a little overvalued and there's just too many question marks...
Money and Finance
AT&T Stock Analysis
I ran AT&T through my screening process to see where it currently stands. AT&T is closed on Friday 3/23/12 at $31.52.
DCF Valuation:
Analysts expect AT&T to grow 7.78% per year for the next 5 years and I've assumed that after that they will grow at 2.00%. Running those numbers through the DCF analysis with a 10% discount rate gives a value of $37.21. DCF valuation shows that AT&T is currently undervalued by 15.29%.
Graham Number:
Walmart's TTM EPS is $0.67 with a BVPS of $17.81. Using the Graham Number calculation you get a value of $16.39. Using these numbers AT&T is overvalued by approximately 92%; however, the TTM EPS value is artificially low due to the failed buyout of T-Mobile. If you recalculate based off the forecast $2.35 EPS you get $30.69 meaning that AT&T is currently overvalued by approximately 2.71%.
Average High Dividend Yield:
AT&T's average high dividend yield for the prior 10 years is 6.13% and for the previous 5 years it's 6.36%. Based on the 10 year yield, AT&T's low price should be $28.71. The price based on the 5 year yield is $27.67. This means that AT&T is overvalued by 9.80% and 13.93% respectively.
Average Low PE Ratio:
AT&T's average Low PE Ratio for the past 10 years is 14.90. This number is closer to 12 if you take out the current trailing PE ratio of 47 that AT&T has. Using the 10 year average however you get a value of $35.03 based on analyst estimates of $2.35 EPS. This means that AT&T is currently undervalued by approximatley 10%. The 5 year calculations give a price target of $40.95 with a PE ratio of 17.42. These are even more skewed because of the current 47 PE ratio, taking that out you get a PE target of 11.40 with a price target of $26.79.
Dividend Discount Model:
For the DDM I assumed that AT&T will be able to grow dividends for the next 5 years at the minimum of 15% or the lowest of the 1, 3, 5 or 10 year growth rates. In this case that would be 2.33%. After that I assumed AT&T can continue to raise dividends by 2.0% and used a discount rate of 7.5%. Based on this AT&T is worth $30.71 meaning it's overvalued by 2.63%.
PE Ratios:
AT&T's trailing PE is 47.04 and it's forward PE is 12.41. The trailing PE is so high due to the payout of the failed T-Mobile acquisition. The CAPE for the previous 10 years is 16.26 and taking out the trailing PE from that calculation gives an CAPE of 15.15.
Fundamentals:
AT&T's gross margin is for FY 2011 was 45.28% and FY 2010 was 49.04%. I don't like the direction that the gross margin is heading but it is still very high which is nice to see. They're profit for for FY 2011 was 3.11% and FY 2010 was 15.98%. Once again the T-Mobile issue is rearing it's head. The Cash-to-Debt ratio is 0.05. I'm not too worried about the Cash-to-Debt ratio since AT&T is essentially a utility that demands lots of capital investments usually meaning more debt.
Share Buyback:
AT&T's shares outstanding have increased every year since 2008. Most recently it increased another 1.97%.
Dividend Analysis:
Obviously with a company like AT&T you're interested in current yield and not the dividend growth rate. AT&T's current yield is 5.58%. The 1 year growth rate is 2.33%, 3 year 2.38%, 5 year 4.39% and 10 year 5.69%. None of these are barnburning growth rates but if AT&T can get the growth rate closer to 5% it would be very intriguing.
The payout ratio has been fairly steady above the 70% mark. I would prefer that the payout ratio be lower to allow for larger increases but in AT&T's case I think it's prudent to allow a higher payout ratio. Once again, with AT&T your looking for either stability or high current yield not necessarily dividend growth.
Return on Equity and Return on Capital Invested:
AT&T's ROE and ROCI have been all over the place. Between 2001 and 2006 both values were trending down and since then they began expanding again. The following graph shows AT&T's ROE and ROCI since 2001.

Average Price and EPS:

EPS have been all over the place the past 2 years with a huge increase from 2009 to 2010 and then a huge drop off from 2010 to 2011.
Forecast:
The chart shows the historical prices for the previous 10 years and the forecast based on the average PE ratios and the expected EPS values. I have also included a forecast based off a PE ratio that is only 75% of the average low PE ratio for the previous 10 years. I like to the look to buy at the 75% Low PE price or lower to provide for additional margin of safety. Currently AT&T is trading only $5.25 higher than this value.

Conclusion:
The average of all the valuation models gives a value of $32.47 which means that AT&T is currently trading at a 2.92% discount to the fair value.
Overall I think that AT&T is slightly overvalued at the current price. I would look to get at least a 6% entry yield which corresponds to a purchase price of $29.33. At that entry price you would begin your accumulation at a 16.5% discount to the average valuation. So in other words AT&T is not a stock I would be purchasing now and I would wait for the price to drop.
Selling puts would be one way to begin purchasing at a good margin of safety; however, the current put premiums would not meet my criteria unless you go out until at least July. And even then you would be looking at a only a 5.15% CAGR if the shares were not put to you.
- Mcdonald's Stock Analysis
It's about time for another stock analysis. This time I decided to take a look atMcDonalds (MCD). McDonalds closed on Thursday 5/17/12 at $89.62. Company Background: McDonalds Corporation, together with its subsidiaries, franchises and operates...
- Mattel Stock Analysis
After seeing a few articles about Mattel after selling off due to a weak 1st quarter, which is fairly typical seeing as how they sell toys and after the Christmas season spending is usually light, I decided to run Mattel (MAT) through my screening process...
- Harris Corporation Stock Analysis
I ran Harris Corporation (HRS) through my screening process to see where it currently stands. HRS closed on Wednesday 4/11/12 at $43.81. Company Background: Harris Corporation, together with its subsidiaries, operates as a communications and information...
- Nucor Stock Analysis
Nucor (NUE) operates mini-mills in the steel process. I recently ran their numbers through my spreadsheet and I'm fairly intrigued by the possibilities. Especially since I think the global economy is improving and the demand for steel should increase...
- Jnj Stock Analysis
I've started to try and consolidate my stock analysis spreadsheets to make it easier for myself to cruch numbers. I like JNJ and would love to get in but right now it seems that it's a little overvalued and there's just too many question marks...
